http://online.wsj.com/article/SB10001424052748704786204574607993448916718.html?mod=WSJ_hp_mostpop_read
ABREAST OF THE MARKET
DECEMBER 20, 2009
Investors Hope the '10s Beat the '00s
by Tom Lauricella
Since End of 1999, U.S. Stocks' Performance Has Been the All-Time Clunker; Even 1930s Beat It
.

The U.S. stock market is wrapping up what is likely to be its worst decade ever.
In nearly 200 years of recorded stock-market history, no calendar decade has seen such a dismal performance as the 2000s.
Investors would have been better off investing in pretty much anything else, from bonds to gold or even just stuffing money under a mattress. Since the end of 1999, stocks traded on the New York Stock Exchange have lost an average of 0.5% a year thanks to the twin bear markets this decade.
The period has provided a lesson for ordinary Americans who used stocks as their primary way of saving for retirement.
Many investors were lured to the stock market by the bull market that began in the early 1980s and gained force through the 1990s. But coming out of the 1990s—when a 17.6% average annual gain made it the second-best decade in history behind the 1950s—stocks simply had gotten too expensive. Companies also pared dividends, cutting into investor returns. And in a time of financial panic like 2008, stocks were a terrible place to invest.
With two weeks to go in 2009, the declines since the end of 1999 make the last 10 years the worst calendar decade for stocks going back to the 1820s, when reliable stock market records begin, according to data compiled by Yale University finance professor William Goetzmann. He estimates it would take a 3.6% rise between now and year end for the decade to come in better than the 0.2% decline suffered by stocks during the Depression years of the 1930s.
The past decade also well underperformed other decades with major financial panics, such as in 1907 and 1893.
"The last 10 years have been a nightmare, really poor," for U.S. stocks, said Michele Gambera, chief economist at Ibbotson Associates.
While the overall market trend has been a steady march upward, the last decade is a reminder that stocks can decline over long periods of time, he said.
"It's not frequent, but it can happen," Mr. Gambera said.
To some degree these statistics are a quirk of the calendar, based on when the 10-year period starts and finishes. The 10-year periods ending in 1937 and 1938 were worse than the most recent calendar decade because they capture the full effect of stocks hitting their peak in 1929 and the October crash of that year.
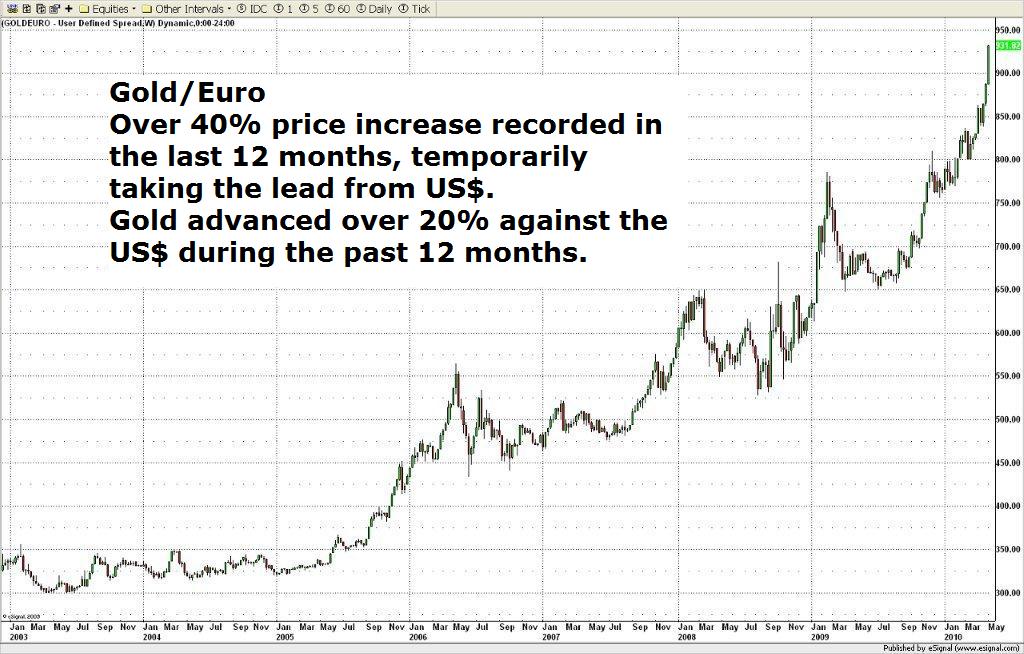
From 2000 through November 2009, investors would have been far better off owning bonds, which posted gains ranging from 5.6% to more than 8% depending on the sector, according to Ibbotson. Gold was the best-performing asset, up 15% a year this decade after losing 3% each year during the 1990s.
This past decade looks even worse when the impact of inflation is considered.
Since the end of 1999, the Standard & Poor's 500-stock index has lost an average of 3.3% a year on an inflation-adjusted basis, compared with a 1.8% average annual gain during the 1930s when deflation afflicted the economy, according to data compiled by Charles Jones, finance professor at North Carolina State University. His data use dividend estimates for 2009 and the consumer price index for the 12 months through November.
Even the 1970s, when a bear market was coupled with inflation, wasn't as bad as the most recent period. The S&P 500 lost 1.4% after inflation during that decade.
That is especially disappointing news for investors, considering that a key goal of investing in stocks is to increase money faster than inflation.
"This decade is the big loser," said Mr. Jones.
For investors counting on stocks for retirement plans, the most recent decade means many have fallen behind retirement goals. Many financial plans assume a 10% annual return for stocks over the long term, but over the last 20 years, the S&P 500 is registering 8.2% annual gains.
Should stocks average 10% a year for the next decade, that would lift the 30-year average return to only 8.8%, said North Carolina State's Mr. Jones. It is even worse news for those who started investing in 2000; a 10% return a year would get them up to only 4.4% a year.
There were ways to make money in U.S. stocks during the last decade. But the returns paled in comparison with those posted in the 1990s.
Of the 30 stocks today that comprise the Dow Jones Industrial Average, only 13 are up since the end of 1999, and just two, Caterpillar Inc. and United Technologies Corp., doubled over the 10-year span.
So what went wrong for the U.S. stock market?
For starters, it turned out that the old rules of valuation matter.
"We came into this decade horribly overpriced," said Jeremy Grantham, co-founder of money managers GMO LLC.
In late 1999, the stocks in the S&P 500 were trading at about an all-time high of 44 times earnings, based on Yale professor Robert Shiller's measure, which tracks prices compared with 10-year earnings and adjusts for inflation. That compares with a long-run average of about 16.
Buying at those kinds of values, "you'd better believe you're going to get dismal returns for a considerable chunk of time," said Mr. Grantham, whose firm predicted 10 years ago that the S&P 500 likely would lose nearly 2% a year in the 10 years through 2009.
Despite the woeful returns this decade, stocks today aren't a steal. The S&P is trading at a price-to-earnings ratio of about 20 on Mr. Shiller's measure.
Mr. Grantham thinks U.S. large-cap stocks are about 30% overpriced, which means returns should be about 30% less than their long-term average for the next seven years. That means returns of just 1.6% a year before adding in inflation.
Another hurdle for the stock market has been the decline in dividends that began in the late 1980s.
Over the long term, dividends have played an important role in helping stocks achieve a 9.5% average annual return since 1926. But since that year, the average yield on S&P 500 stocks was roughly 4%. This decade it has averaged about 1.8%, said North Carolina State's Mr. Jones.
That difference "doesn't sound like much," said Mr. Jones, "but you've got to make it up through price appreciation." Unless dividends rise back toward their long-term averages, Mr. Jones thinks investors may need to lower expectations. Rather than the nearly 10% a year that has been the historical average, stocks may be good for only about 7%.
Write to Tom Lauricella at tom.lauricella@wsj.com
Correction & Amplification
The 1950s represented the best decade for stock-market returns. a previous version of this article stated that the best decade was the 1990s.


![[Most Recent Quotes from www.kitco.com]](http://www.kitconet.com/charts/metals/gold/t24_au_en_eukg_2.gif)
No comments:
Post a Comment